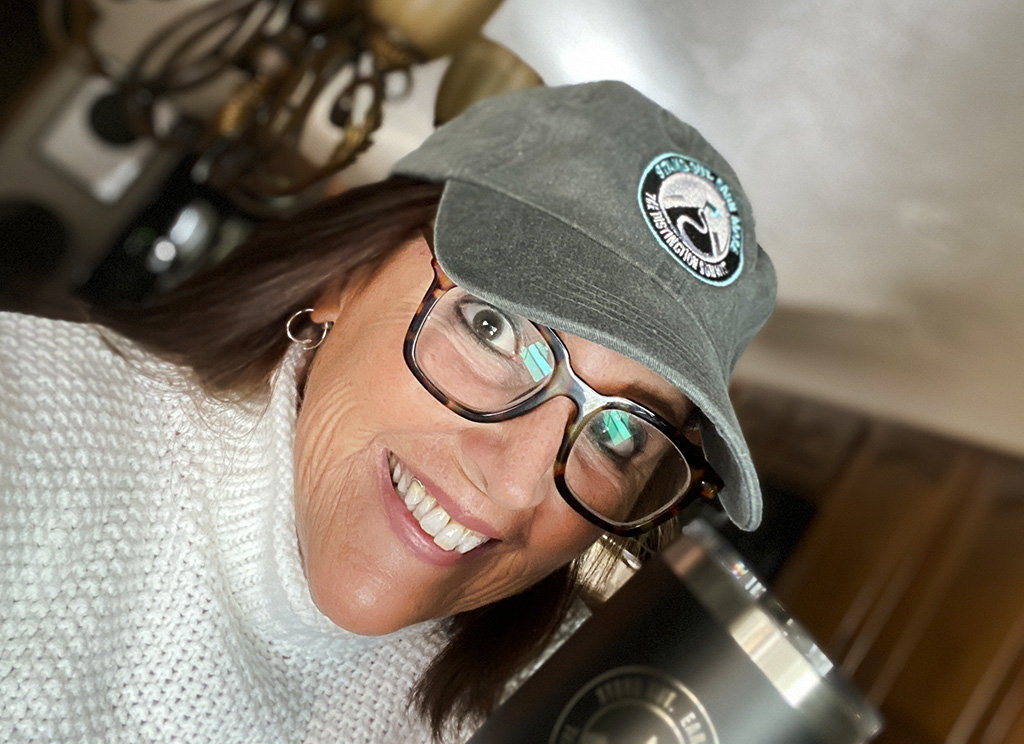
I popped on Facebook and noticed I had an “on this day” to view. My glance back at history was a photo I posted one year ago pushing the Distinction Summit — an online 3-day event we held in 2020 that we aren’t doing again this October. I posted that same photo here too:
The thing I first noticed is that in the photo from one-year ago I’m wearing a turtleneck sweater. Today’s 72° F forecast is NOT heavy sweater weather. So I came back to whatifitdid and searched for the day to see what the heck the weather was like in mid-October, 2020. I didn’t find that, but I did find the COVID severity numbers on that day. Comparing apples to apples (same website – same ‘who knows how accurate’ numbers) what I found was interesting.
The numbers below are calculated on daily cases per 100k on a 7-day rolling average.
- Indiana: then – 24.6; now – 29.5 (65% of population with at least 1st vaccine)
- Jackson County, IN: then – 37.8; now – 27.5 (52% of population with at least 1st vaccine)
- Nevada: then – 19.6; now – 22.0 (74.5% of population with at least 1st vaccine)
- Florida: then – 12.6; now – 12.6 (80% of population with at least 1st vaccine)
So all states/counties that I watch are either the same or higher than they were 1-year ago today. But don’t forget… along came the Delta variant. While numbers remain near the same even though we’re no longer locked down or restricted, as of today, 57.0% of all the US has been fully vaccinated, and 65.9% have taken at least the first dose.
Notice the lower numbers are in the states where vaccine percentages are higher. Does that prove the vaccines work? Maybe not… but it’s good enough to at least indicate we should encourage vaccinations me thinks. 🙂
Finally, although I’m not posing for a photo this morning, another female in the house was more than happy to:


